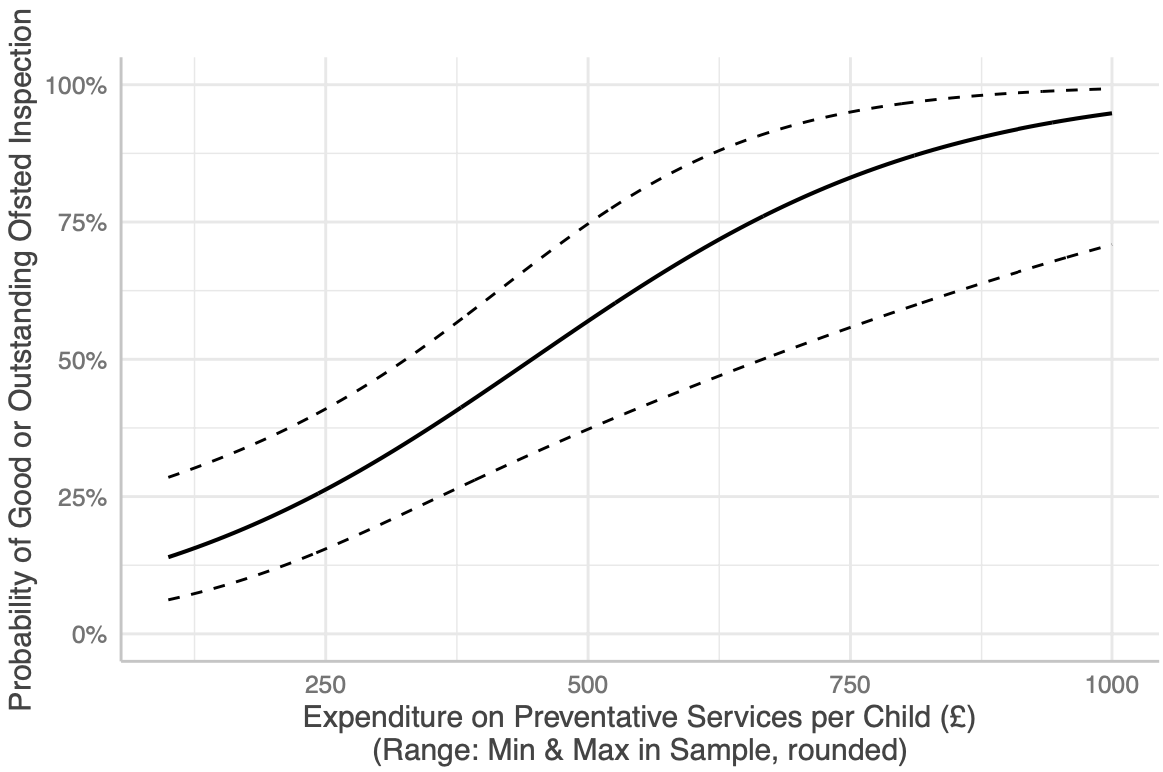
Children's Services Ofsted Judgements, Funding, and Poverty: A level playing field?
This post summarises a research article that explored whether Ofsted judgements over the past ten years were associated with local authority expenditure and levels of deprivation. The inspectorate has previously maintained that funding and deprivation pale in comparison to leadership, but is this true? Our research suggests that higher spending on early help and family support and lower poverty is associated with a greater likelihood of positive ratings.

The Case for Change: A response
This submission has been compiled by a group of university researchers whose work has addressed similar themes and issues, with a common concern being the relationship between children’s social care services, socio-economic factors such as poverty and deprivation, and avoidable inequalities in child welfare interventions. It builds upon a previous submission made by the authors in response to the Call for Evidence.

Nothing to see here! Why 2010-11 and 2011-12 matter when it comes to the recent history of local authority finances
Let's clear up some misconceptions about data on local authority children's services spending over the past ten years. I've seen this discussion pop up now and again in relation to the Independent Review of Children's Social Care's Case for Change, but also in internal and external reviews of academic journal articles.

Sufficiency is more important than efficiency if you want to improve public services
Things seemed to be going well. There was a general acknowledgment in the room that family support services and early help interventions were well worth investing in. And then, very slowly, the focus of the conversation started to change.

Socioeconomic inequalities in child welfare interventions are five times stronger in unequal and affluent local authorities than they are in equal and deprived local authorities. Why?
One of the articles we had published in Children and Youth Services Review this year highlighted a new finding that the social gradient in child welfare interventions was predicted to be as much as five times stronger in local authorities with both lower-than-average deprivation and higher-than-average income inequality than it was in local authorities with higher-than-average deprivation and lower-than-average income inequality. This blog post explores one reason why this might be.

A few lines of code separate quantitative analysis from predictive analytics
The programming equivalent of a hair's breadth stands between the code required to analyse trends, associations, and inequalities in data and the code required to turn these into contextless, essentialist predictions.
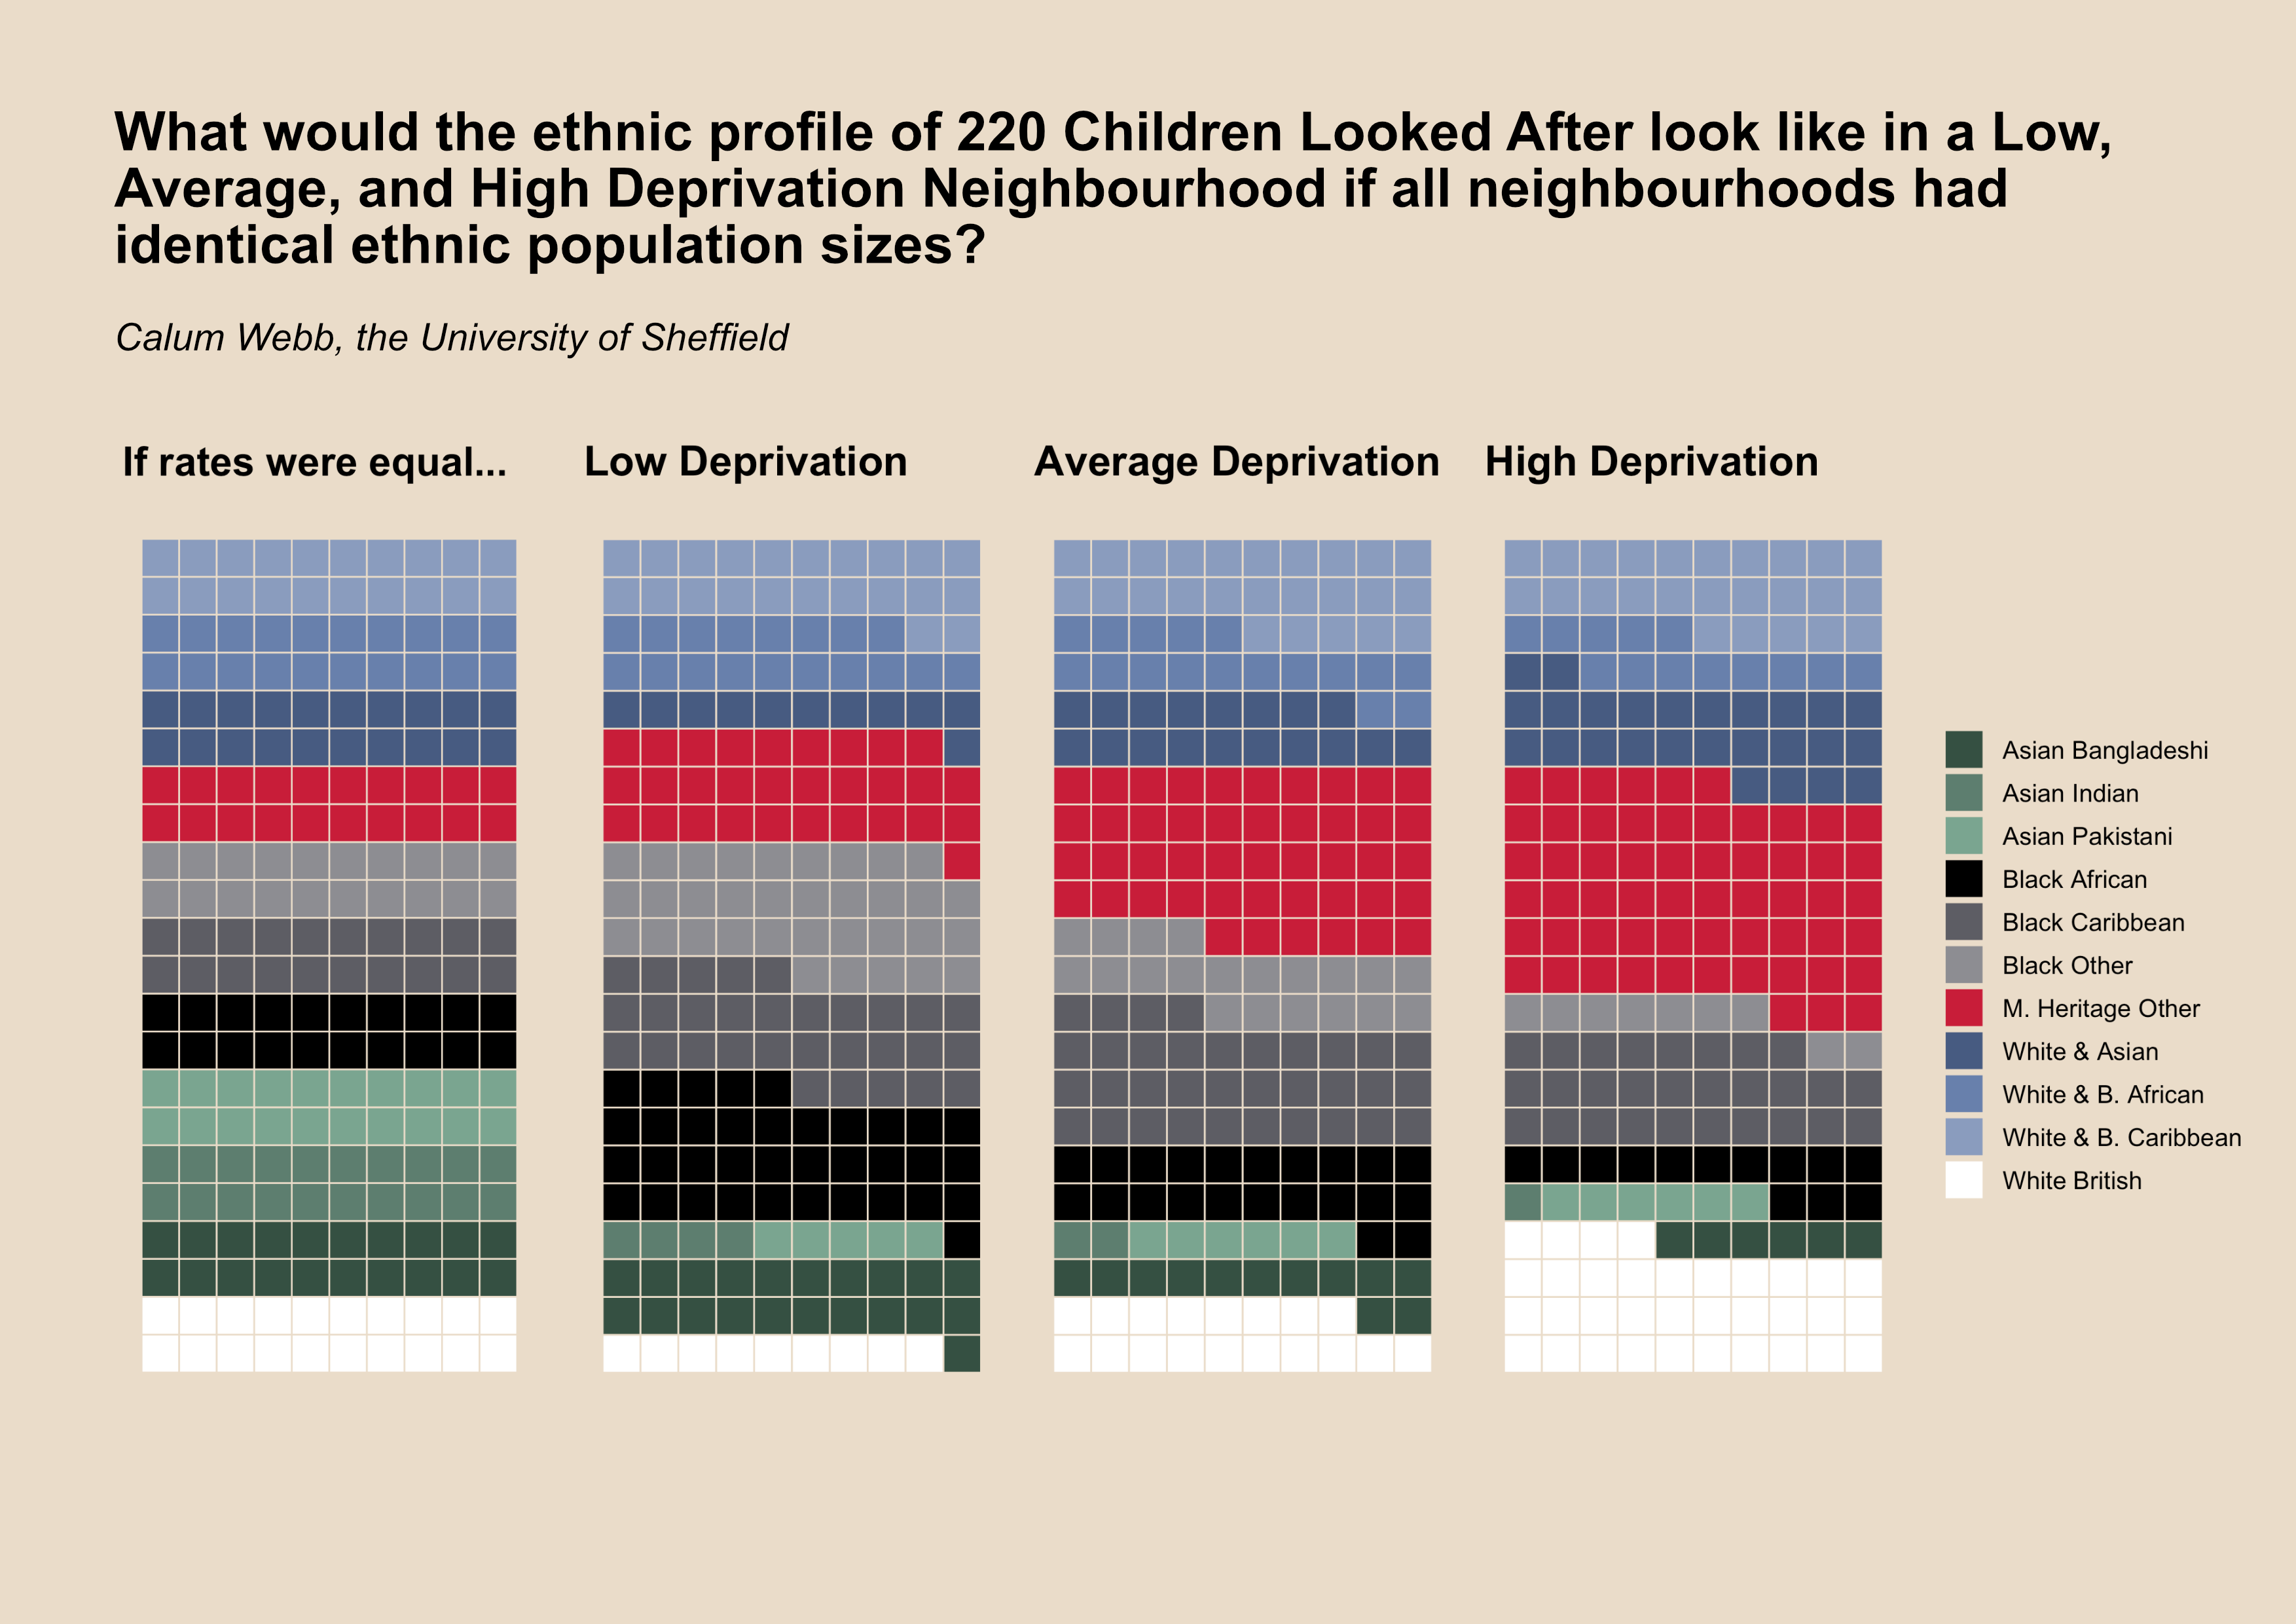
Anti-racist and anti-poverty social work must be both: Child Welfare Inequalities at the intersection of race and class
Our new research published in Children and Youth Services Review shows how the social gradient varies based on ethnic population, and what sociological theories and policy analysis might explain why this happens. This blog discusses some of the key messages for social work.
The Child Welfare Inequalities App Version 2: Now in Open Beta
Anyone can now use and test the Child Welfare Inequalities App version 2. This blog post provides a link to the new version of the app, plus a brief description of its features.

Ethnic Inequalities in Local Authority Children Looked After Rates (CWIP v2 Plots Preview)
Charts that show how unequal children looked after rates appear to be across ethnic groups in local authorities in England.
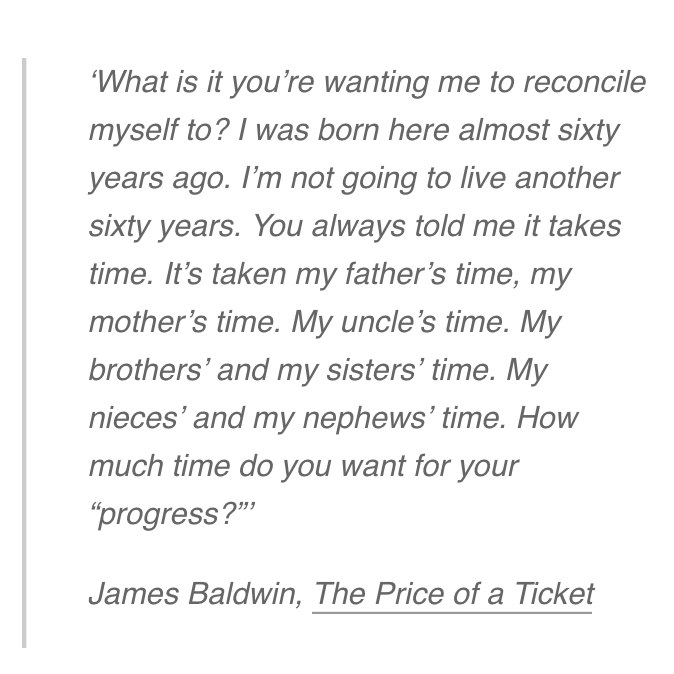
'More evidence needed...' Pessimism of a sociologist in the age of justice procrastination.
How much time do you want for your progress?
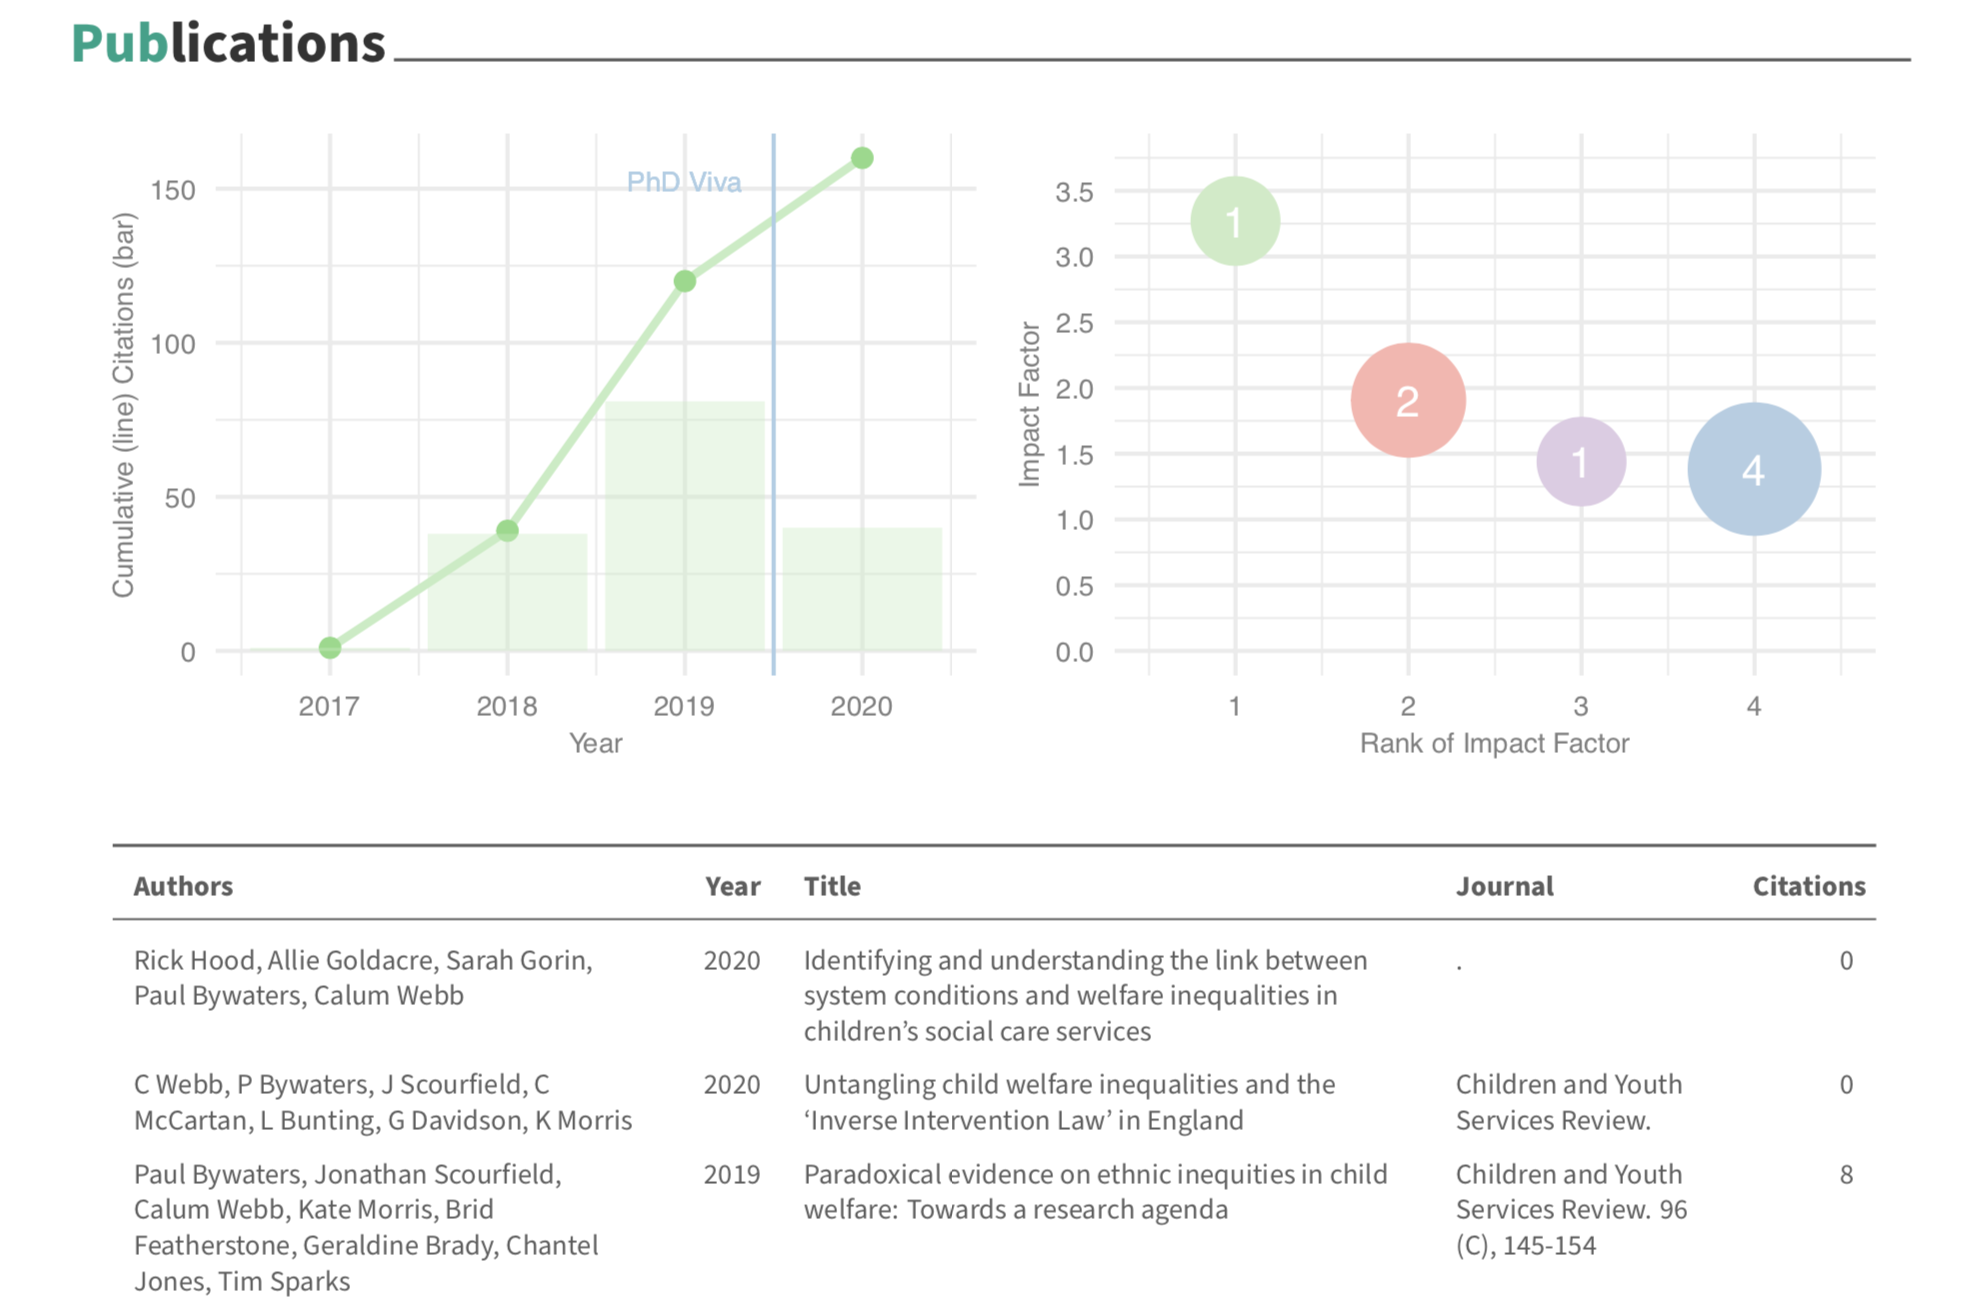
Citations Grabber
Adventures into automating my CV and creating a tool for collating citations from Google Scholar and education and employment details from ORCID.

Policy and Practice or Structural Inequality? Challenging the popular interpretation of the NAO's 2019 report on pressures on children's social care.
A common myth that seems to stem from interpretations of the NAO's analysis of children's social care is that most differences between local authorities are down to local policy and practice, and that structural disadvantage explains comparatively little. Our research challenges this interpretation.

The biggest problem with the funding formula for Children's Social Services isn't that it's too inequitable, it's that it's too relative.
It is a mathematical fact that the larger the gap between the resources needed and the resources provided is, the more inequitable a relative funding formula becomes, regardless of how accurate its proportioning is.
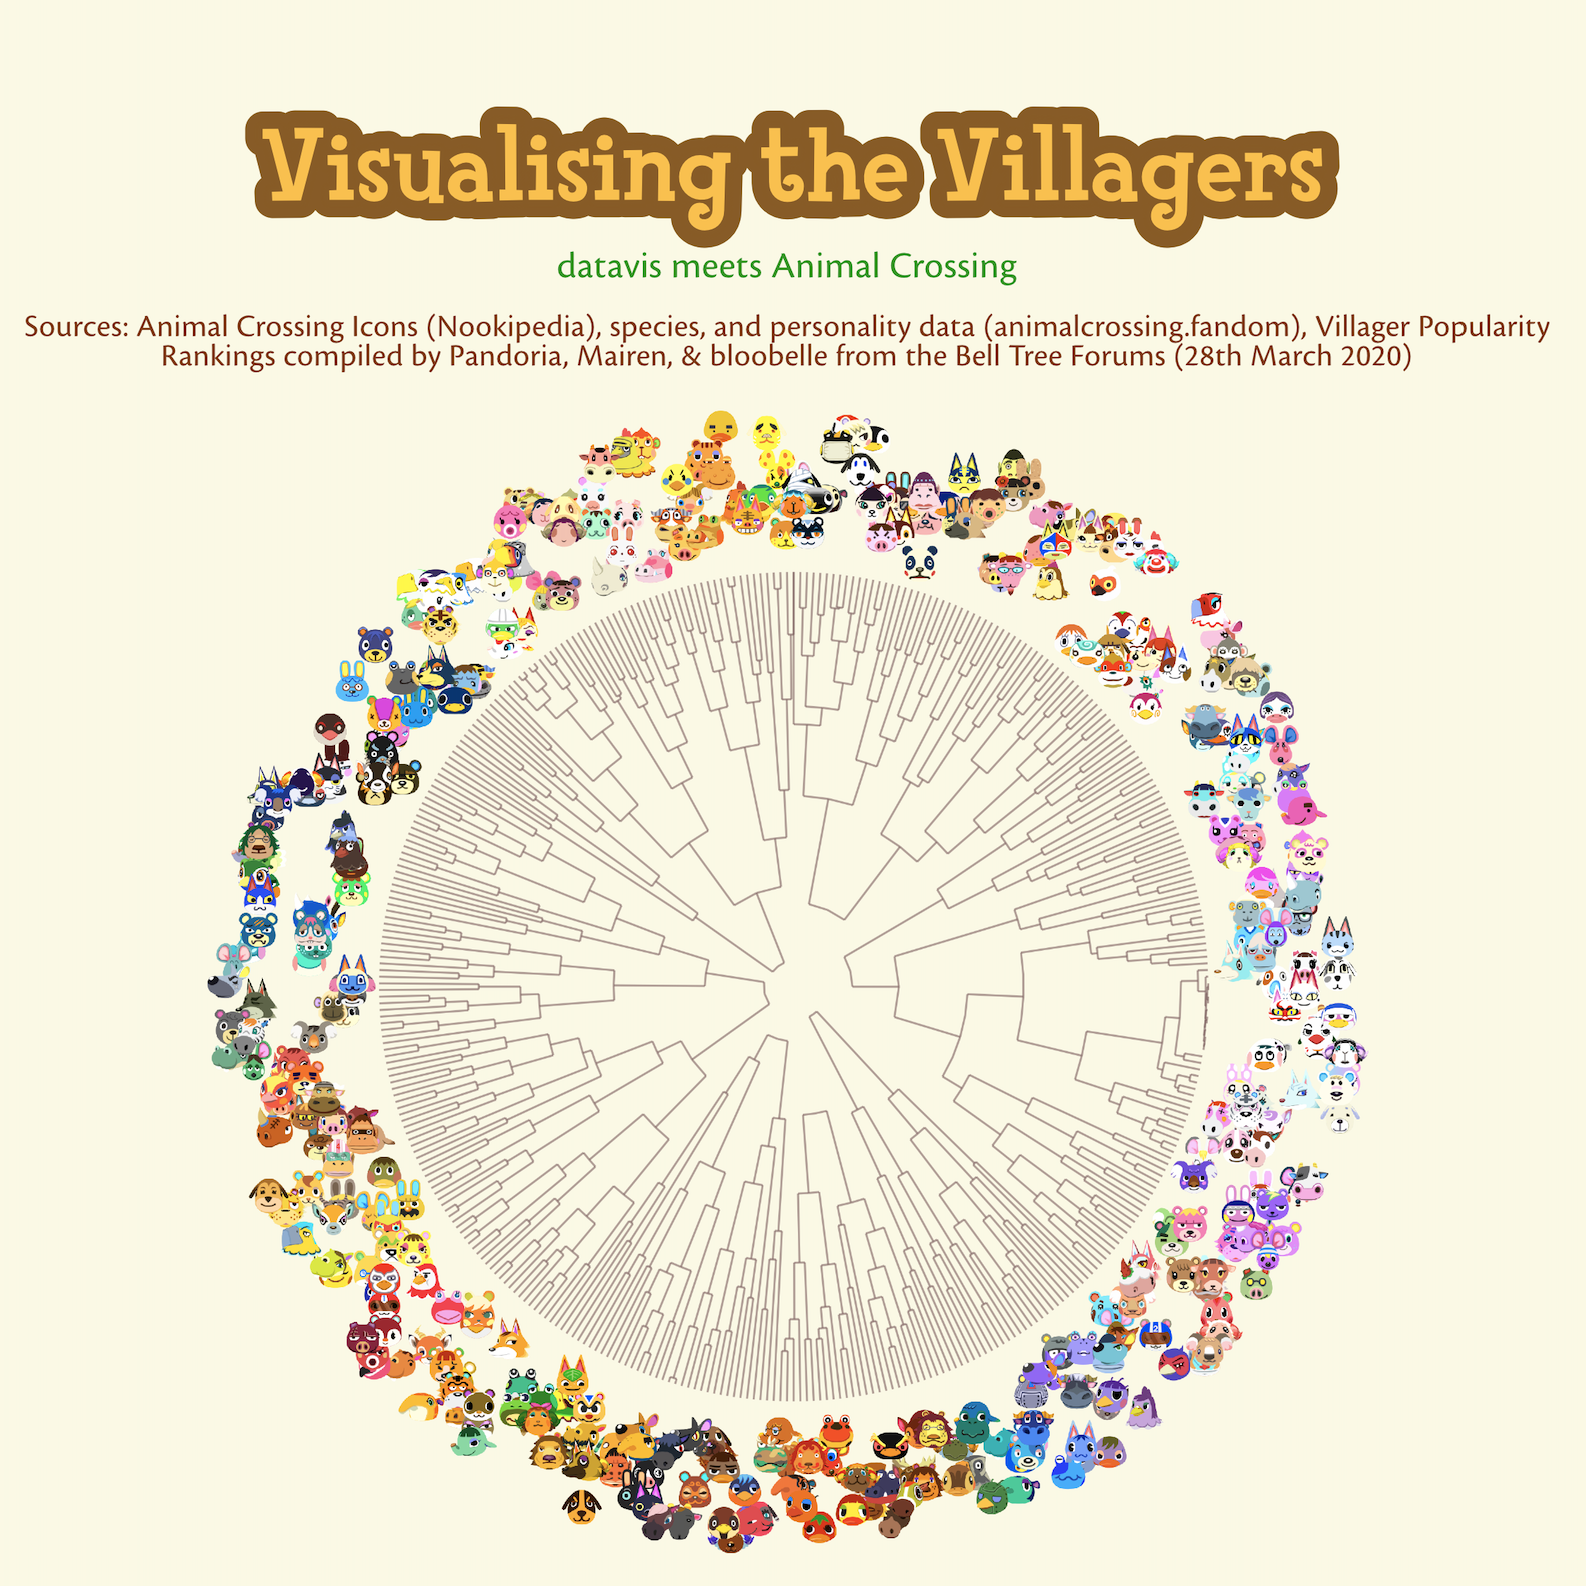
Poster: Visualising the Villagers, datavis meets Animal Crossing
Which animal crossing villagers look most alike? Which villagers are the most popular? What personality types are most common for each species and how do they like their coffee?

Tidy Tuesday 21/01/2020: Spotifyr. Hierarchical clusters of popular songs by audio features
Using audio features to create "perfect pairings" of popular songs? Pretty dendrograms using ggdendro.